Grafana dashboard
Prerequisite: Prometheus scrape
Set metrics_port in your config to a non-zero value so Barbacana opens its /metrics listener, and point Prometheus at it. With the default metrics_port: 0, no metrics endpoint exists and the dashboard panels stay empty.
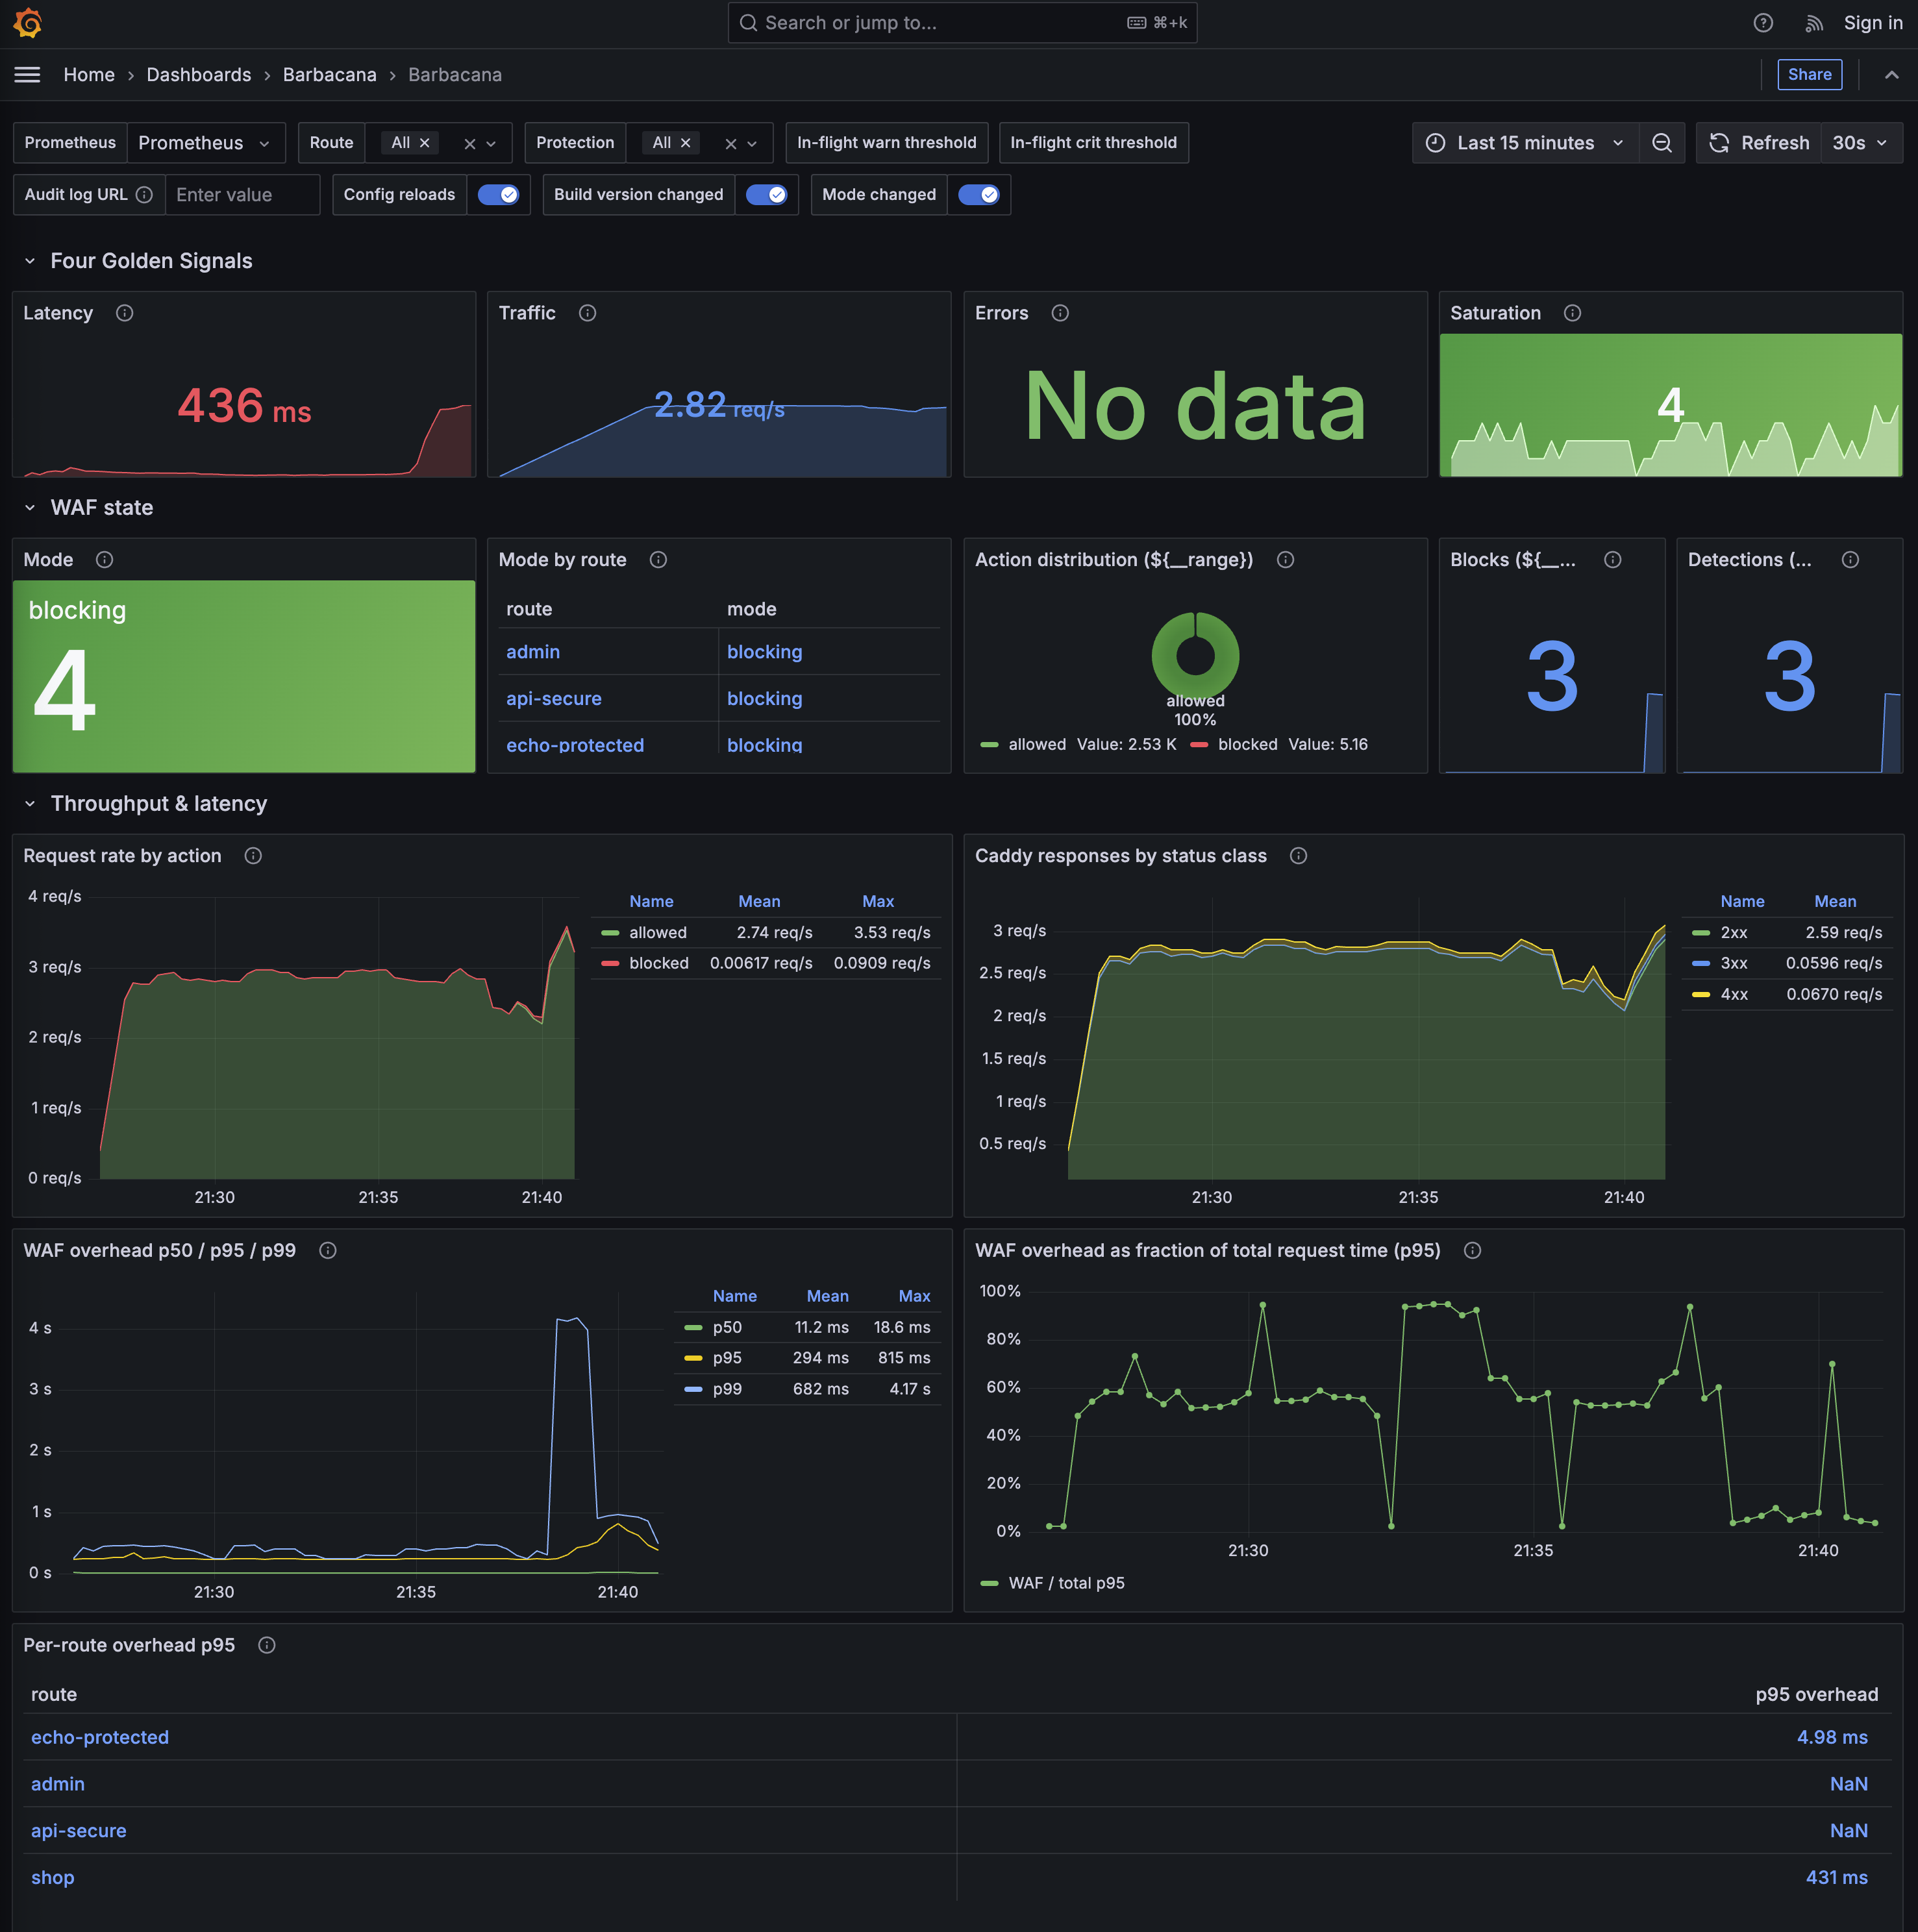
Barbacana ships a single Grafana dashboard organised around the Site Reliability Engineering (SRE) Four Golden Signals — Latency, Traffic, Errors, Saturation. One JSON, one import, one URL to bookmark. This is a starting point; modify it as needed.
Importing into Grafana
-
Download
barbacana.jsonfrom the docs assets. -
In Grafana, open Dashboards → New → Import. Upload the file (or paste the JSON), pick your Prometheus data source when prompted, and save.