Distributed tracing
Barbacana exports OpenTelemetry traces using the OpenTelemetry Protocol (OTLP). Trace context is propagated to your upstream via the W3C traceparent header, so a single distributed trace continues from your client, through the WAF, into your application — without any transport wrapping or shim.
Off by default
Tracing is opt-in. With the tracing block absent or enabled: false, no exporter is created and no OTLP traffic ever leaves the process. Barbacana running without an OTel collector configured makes zero network calls for tracing.
Why turn it on
A trace shows where time is spent in a request. With Barbacana in front of your server you usually want to answer one of three questions:
- Is the WAF the bottleneck? A trace exposes WAF overhead per stage versus upstream time, so you can determine whether the WAF is the bottleneck.
- Why was a request slow? Pivot from a slow audit log entry straight to its trace using the trace ID embedded in the audit document.
- Did the WAF block this? A trace tagged with
waf.action=blockedandwaf.protection=<name>makes a missing upstream call self-explanatory.
Enabling
Two pieces are required: a tracing: block in waf.yaml, and a reachable OTLP collector.
version: v1alpha1

tracing:
  enabled: true
  endpoint: otel-collector:4317     # gRPC default port; use 4318 for HTTP/protobuf
  protocol: grpc                    # grpc (default) or http
  insecure: true                    # in-cluster, plain text; flip to false for TLS

routes:
  - upstream: http://app:8000
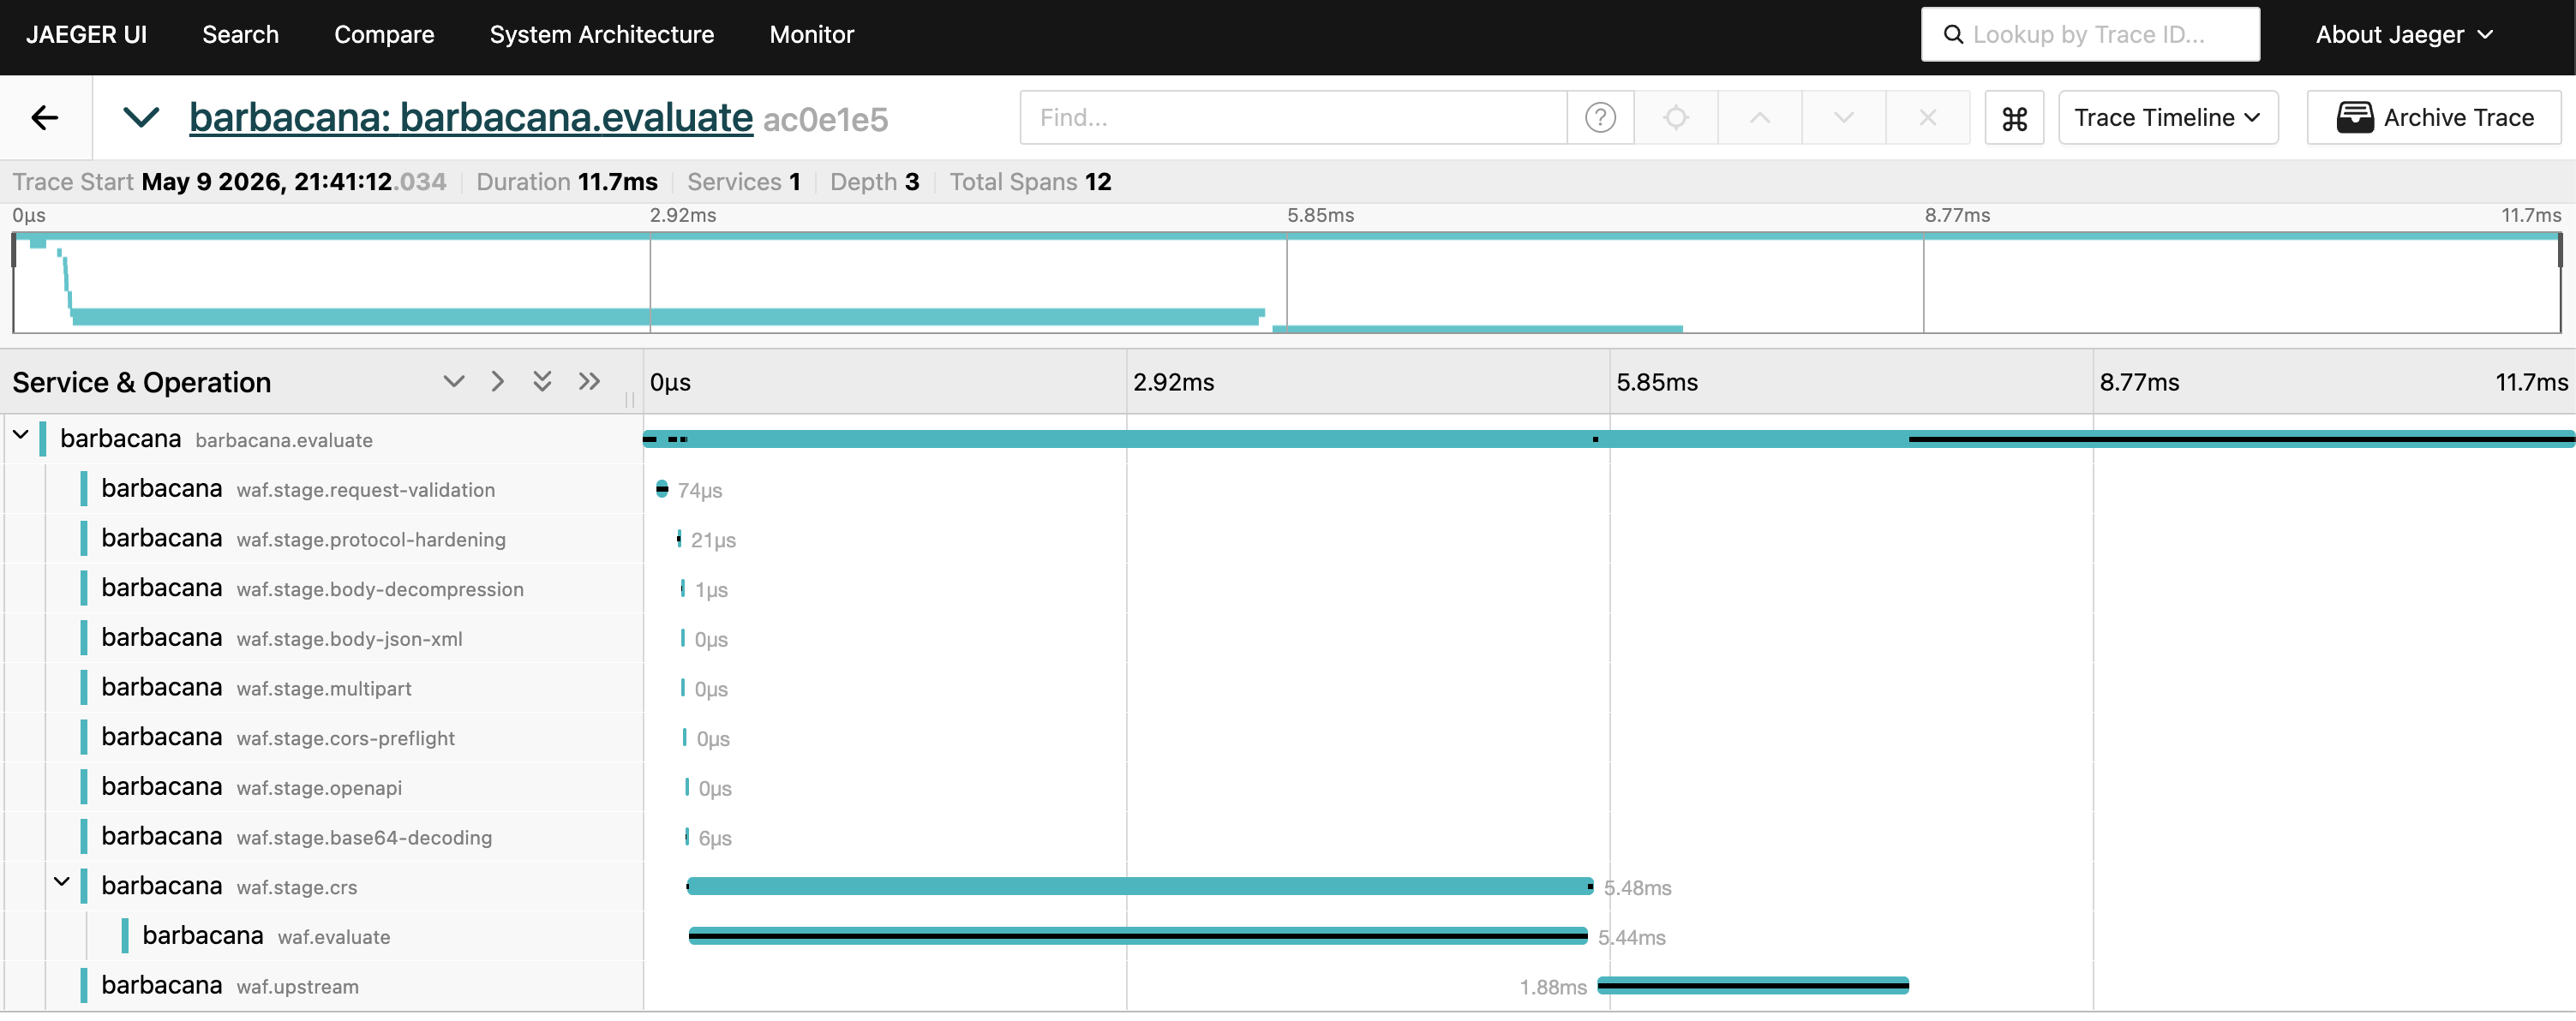
The following picture shows a Jaeger trace view of a single Barbacana request, with the barbacana.evaluate parent span and stage-level child spans:
Any OTLP-compatible collector works. The most common targets:
- Jaeger v1.35 or newer (native OTLP gRPC on
:4317, HTTP on:4318) - Grafana Tempo
- OpenTelemetry Collector (forwards to whatever your stack uses — Datadog, Honeycomb, Splunk Observability, New Relic, …)
Configuration reference
See config schema → Tracing for the full field table. The shape:
tracing:
  enabled: false           # default; flip to true to ship traces
  protocol: grpc           # grpc (default) or http (== http/protobuf)
  endpoint: ""             # falls back to OTEL_EXPORTER_OTLP_ENDPOINT
  insecure: true           # default; set false to require TLS to the collector
  headers:                 # optional, e.g. for auth
    authorization: "Api-Token <secret>"
  timeout: ""              # optional, e.g. 5s

  service:
    name: ""               # defaults to "barbacana" when empty
    namespace: ""
    version: ""            # defaults to the build's internal version when empty
Authenticated collectors
If your collector requires an auth header (Honeycomb, Grafana Cloud, vendor-hosted Tempo), put it in tracing.headers:
tracing:
  enabled: true
  protocol: http                                 # most hosted vendors require HTTP/protobuf
  endpoint: https://api.honeycomb.io
  insecure: false
  headers:
    x-honeycomb-team: "<your-api-key>"
Environment variable fallbacks
A subset of the standard OTLP exporter environment variables are honoured when the corresponding YAML field is empty:
| Env var | YAML field |
|---|---|
OTEL_EXPORTER_OTLP_ENDPOINT |
tracing.endpoint |
OTEL_EXPORTER_OTLP_HEADERS |
tracing.headers |
OTEL_EXPORTER_OTLP_TIMEOUT |
tracing.timeout |
OTEL_RESOURCE_ATTRIBUTES |
resource attributes other than service.name and service.version |
YAML wins when both are set. Other OTel environment variables (including OTEL_SERVICE_NAME, OTEL_EXPORTER_OTLP_PROTOCOL, OTEL_TRACES_SAMPLER, and OTEL_TRACES_SAMPLER_ARG) are not currently consulted — set the matching YAML fields, or use tracing.protocol / tracing.service.name instead.
Trace propagation to your server
Barbacana extracts the incoming traceparent and tracestate headers, opens its own server span as a child, and re-injects the active context back into the outgoing request to your server. Caddy's reverse proxy forwards request headers as-is, so your server sees a continued trace context with the WAF span as parent.
Concretely:
- A client that already speaks W3C trace context (Browser RUM, OTel SDK in another service) keeps the same trace ID end to end.
- A client without trace context starts the trace at the WAF; your server still sees a
traceparentheader pointing at the WAF span. - You do not need an OTel SDK in your server to benefit. The trace continues to your server's transport even if the server itself does not emit spans — and if it does, they nest naturally under the WAF span.
Audit log correlation
When tracing is enabled, every audit log entry carries the active span's IDs:
| Format | Trace ID field | Span ID field |
|---|---|---|
| OCSF (default) | metadata.trace_id |
metadata.span_id |
| ECS | trace.id (top level) |
span.id (top level) |
When tracing is disabled, the trace and span keys are absent from the audit document — the formatter does not emit them as empty strings.
See audit log → Trace correlation for full document examples.
What is not exported as traces
- Metrics. Metrics are exposed via Prometheus scrape on
/metrics. Barbacana intentionally does not export OTel metrics over OTLP — running both creates a double-counting risk. Use Prometheus for time-series. - Audit logs. Logs are written to stdout in OCSF or ECS JSON. They are correlated with traces via the embedded trace ID, but they are not transmitted over OTLP.
- Caddy's bundled
http.handlers.tracingmodule. Barbacana installs its own OTel global TracerProvider; running Caddy's separate tracing module on top would double-export every span. The Caddy module is intentionally unused.
Sampling and cost
Barbacana currently uses the OTel SDK's default sampler — ParentBased(AlwaysSample). Concretely:
- Every request that arrives without an inbound trace context is sampled and exported.
- Every request that arrives with an inbound
traceparenthonours the upstream client's sampling decision (sampledflag → exported, unsampled → dropped).
There is no in-process knob to switch sampler or ratio today. For high-volume internet-facing deployments, the only sustainable approach is tail sampling at the collector layer — the OpenTelemetry Collector's tail_sampling processor lets you keep all errors and a percentage of normal traffic without changing Barbacana's config. For low-volume deployments the default is fine.
Disabling
Remove the tracing: block, or set enabled: false, and reload. The exporter is drained synchronously, the TracerProvider is replaced with the no-op, and no further OTLP traffic leaves the process.